Contact Us
919-782-4505
Making Moves Podcast
Events in the Triangle
Family Foundation
Search Homes
Virtual Home Tours
Open Houses
Featured Homes
Buy A Home
New Construction
Home Buyer FAQs
Contact a Home Lender
Closing Costs
Sell Your Home
Home Valuation
Home Seller FAQs
Preparing Your Home For Sale
Relocate
Moving Tips
Recommended Service Providers
Home Buying Guide
Utility Providers
Areas
Triangle Neighborhoods
Guides
About
Team
Testimonials
Careers
Blog
Contact
Making Moves Podcast
Events in the Triangle
Family Foundation
Category:
Infographics
Home
»
Infographics
»
Page 18
Thinking of Moving? [INFOGRAPHIC]
Some Highlights If you’re ready to sell your house but you’re worried about finding one to move into, why not...
Rising Home Equity Can Power Your Next Move [INFOGRAPHIC]
Some Highlights According to CoreLogic, homeowners across the country are gaining significant equity. Over the past year, the average homeowner...
Why Pricing Your Home Right Matters This Fall [INFOGRAPHIC]
Some Highlights As a seller today, you may think pricing your home on the high end will result in a...
Homes Across the Country Are Selling Fast [INFOGRAPHIC]
Some Highlights Buyers are actively searching for and purchasing homes at a record-breaking pace. According to the latest report from...
Virtual School Is Changing Homebuyer Needs [INFOGRAPHIC]
Some Highlights With remote learning sweeping the nation this academic year, organized spaces with enough room for kids to learn...
The 2020 Homebuyer Wish List [INFOGRAPHIC]
Some Highlights The word “home” is taking on a whole new meaning this year, and buyers are starting to look...
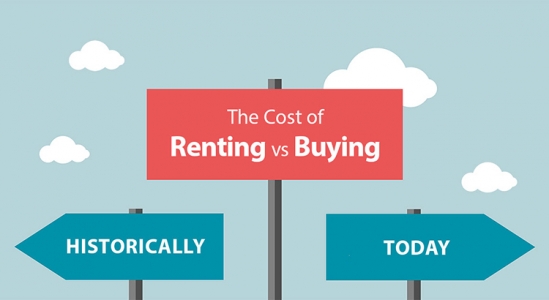
The Cost of Renting Vs. Buying a Home [INFOGRAPHIC]
Some Highlights The percentage of income needed to afford a median-priced home today is declining, while that for renting is...
Ask a Pro About Buying a Home [INFOGRAPHIC]
Some Highlights According to trending data, searches for key real estate topics are skyrocketing online. Clearly, lots of people have...
Mortgage Rates & Payments by Decade [INFOGRAPHIC]
Some Highlights Sometimes it helps to see the dollars and cents you’ll save when you purchase a home while mortgage...
2020 Homebuyer Preferences [INFOGRAPHIC]
Some Highlights A recent study from HarrisX shows the current health crisis isn’t slowing down today’s homebuyers. Many buyers are...
« Previous
1
…
16
17
18
19
20
21
Next »