Contact Us
919-782-4505
Making Moves Podcast
Events in the Triangle
Family Foundation
Search Homes
Virtual Home Tours
Open Houses
Featured Homes
Buy A Home
New Construction
Home Buyer FAQs
Contact a Home Lender
Closing Costs
Sell Your Home
Home Valuation
Home Seller FAQs
Preparing Your Home For Sale
Relocate
Moving Tips
Recommended Service Providers
Home Buying Guide
Utility Providers
Areas
Triangle Neighborhoods
Guides
About
Team
Testimonials
Careers
Blog
Contact
Making Moves Podcast
Events in the Triangle
Family Foundation
Category:
Infographics
Home
»
Infographics
»
Page 12
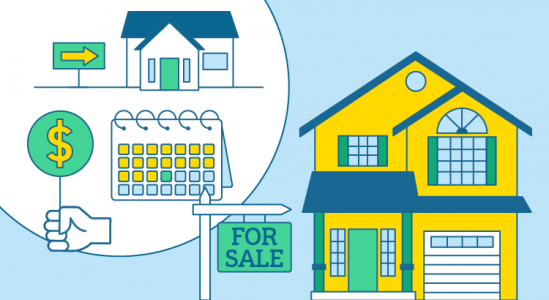
When Is the Right Time To Sell [INFOGRAPHIC]
Some Highlights If you’re trying to decide when to list your house, the time is now. There are plenty of...
How To Hit Your Homebuying Goals This Year [INFOGRAPHIC]
Some Highlights If you’re looking to buy a home, you may want to put these items on your to-do list...
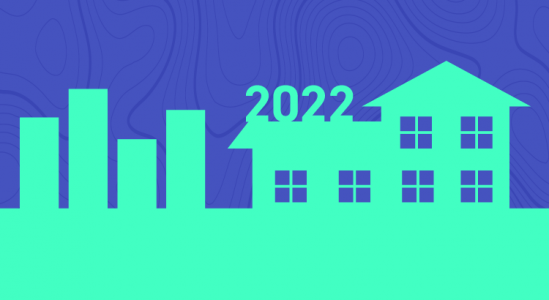
2022 Housing Market Forecast [INFOGRAPHIC]
Some Highlights What does the coming year hold for the housing market? Here’s what experts project for 2022. Mortgage rates...
A Happy Tail: Pets and the Homebuying Process [INFOGRAPHIC]
Some Highlights It’s no secret that we love our furry friends – about 70% of U.S. households have pets. What...
A Checklist for Selling Your House This Winter [INFOGRAPHIC]
Some Highlights If you’re planning to sell your house this winter, you’ll want it to look its best inside and...
Your Journey to Homeownership [INFOGRAPHIC]
Some Highlights When it comes to buying a home, there are a number of key milestones along the way. The...
Should I Update My House Before I Sell It? [INFOGRAPHIC]
Some Highlights If you’re deciding whether you should make updates before you sell your house, lean on your agent to...
Numbers Don’t Lie – It’s Still a Great Time To Sell [INFOGRAPHIC]
Some Highlights Heading into the end of the year, you might wonder if it’s still a good time to sell...
The Mortgage Process Doesn’t Have To Be Scary [INFOGRAPHIC]
Some Highlights Applying for a mortgage is a big step towards homeownership, but it doesn’t need to be one you...
Your Home Equity Is Growing [INFOGRAPHIC]
Some Highlights If you’re a homeowner, today’s rising equity is great news. On average, homeowners have gained $51,500 in equity...
« Previous
1
…
10
11
12
13
14
…
21
Next »